File:CAPspendingbysector.png
Jump to navigation
Jump to search
No higher resolution available.
CAPspendingbysector.png (611 × 382 pixels, file size: 24 KB, MIME type: image/png)
Captions
Captions
Add a one-line explanation of what this file represents

|
File:CAPspendingbysector.svg is a vector version of this file. It should be used in place of this PNG file when not inferior.
File:CAPspendingbysector.png → File:CAPspendingbysector.svg
For more information, see Help:SVG. |
 |
Transferred from en.wikipedia to Commons by Maksim.
The original description page was here. All following user names refer to en.wikipedia.
Summary[edit]
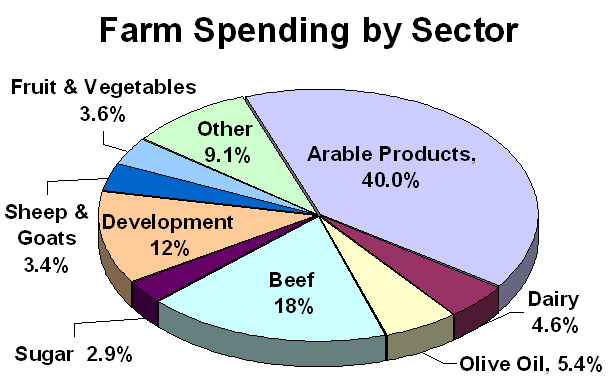
Pie chart showing percentages of CAP expenditure on different agricultural products. Created by me December 2005.
Licensing[edit]
| This work has been released into the public domain by its author, Sandpiper at English Wikipedia. This applies worldwide. In some countries this may not be legally possible; if so: Sandpiper grants anyone the right to use this work for any purpose, without any conditions, unless such conditions are required by law. |
| date/time | username | edit summary |
|---|---|---|
| 21:26, 19 December 2005 | en:User:Sandpiper | (Pie chart showing percentages of CAP expenditure on different agricultural products. Created by me December 2005.) |

|
This image shows some kind of simple graph/chart that could be converted to a Wikichart. Storing graphs or charts as images makes it harder to change (correct or translate) them. Wikicharts also help making sure to be consistent in font and size. |
|
| |
Original upload log[edit]
Legend: (cur) = this is the current file, (del) = delete this old version, (rev) = revert to this old version.
Click on date to download the file or see the image uploaded on that date.
- (del) (cur) 21:26, 19 December 2005 . . en:User:Sandpiper Sandpiper ( en:User_talk:Sandpiper Talk) . . 611x382 (24190 bytes) (Pie chart showing percentages of CAP expenditure on different agricultural products. Created by me December 2005.)
File history
Click on a date/time to view the file as it appeared at that time.
| Date/Time | Thumbnail | Dimensions | User | Comment | |
|---|---|---|---|---|---|
| current | 07:47, 1 April 2006 | | 611 × 382 (24 KB) | Maksim (talk | contribs) | La bildo estas kopiita de wikipedia:en. La originala priskribo estas: == Summary == Pie chart showing percentages of CAP expenditure on different agricultural products. Created by me December 2005. == Licensing == {{PD-self}} {| border="1" ! date/time | |
You cannot overwrite this file.
File usage on Commons
The following 2 pages use this file:
File usage on other wikis
The following other wikis use this file:
- Usage on ca.wikipedia.org
- Usage on en.wikipedia.org
- Usage on eo.wikipedia.org
- Usage on hy.wikipedia.org
- Usage on ia.wikipedia.org
- Usage on ja.wikipedia.org
- Usage on nl.wikipedia.org