File:CAPON mRNA Short-Form Expression by Diagnosis.png
Jump to navigation
Jump to search

Size of this preview: 800 × 473 pixels. Other resolutions: 320 × 189 pixels | 640 × 378 pixels | 1,024 × 605 pixels | 1,280 × 756 pixels | 2,012 × 1,189 pixels.
Original file (2,012 × 1,189 pixels, file size: 83 KB, MIME type: image/png)
Captions
Captions
Add a one-line explanation of what this file represents
Summary[edit]
| Description |
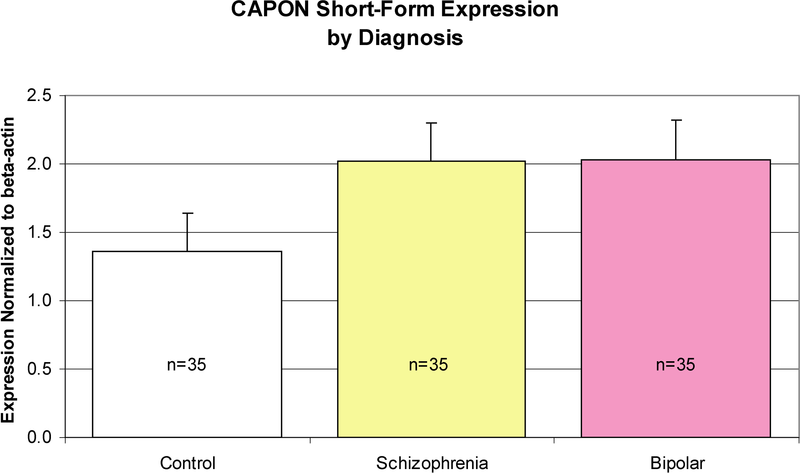
English: Expression levels are least squares means. Mean values per category are plotted with 95% confidence intervals. The number of individuals per sample is indicated within each bar. Expression is significantly higher in patients with schizophrenia (p = 0.0013) and bipolar (p = 0.0009) as compared to controls. The mean (95% confidence interval lower bound, upper bound) for the control, schizophrenia, and bipolar groups are 1.34 (1.05, 1.62), 2.02 (1.73, 2.30), and 2.05 (1.77, 2.34), respectively. |
||
| Date | |||
| Source | PLoS Medicine_ Increased Expression in Dorsolateral Prefrontal Cortex of CAPON in Schizophrenia and Bipolar Disorder | ||
| Author | Xu B, Wratten N, Charych EI, Buyske S, Firestein BL, et al. | ||
| Permission (Reusing this file) |
|
Licensing[edit]
This file is licensed under the Creative Commons Attribution-Share Alike 2.5 Generic license.
- You are free:
- to share – to copy, distribute and transmit the work
- to remix – to adapt the work
- Under the following conditions:
- attribution – You must give appropriate credit, provide a link to the license, and indicate if changes were made. You may do so in any reasonable manner, but not in any way that suggests the licensor endorses you or your use.
- share alike – If you remix, transform, or build upon the material, you must distribute your contributions under the same or compatible license as the original.
File history
Click on a date/time to view the file as it appeared at that time.
| Date/Time | Thumbnail | Dimensions | User | Comment | |
|---|---|---|---|---|---|
| current | 17:01, 26 April 2009 | | 2,012 × 1,189 (83 KB) | CopperKettle (talk | contribs) | {{Information |Description={{en|1=Expression levels are least squares means. Mean values per category are plotted with 95% confidence intervals. The number of individuals per sample is indicated within each bar. Expression is significantly higher in patie |
You cannot overwrite this file.
File usage on Commons
There are no pages that use this file.
File usage on other wikis
The following other wikis use this file:
- Usage on ru.wikipedia.org