File:Atom deBrogie.jpg
Jump to navigation
Jump to search

Size of this preview: 612 × 599 pixels. Other resolutions: 245 × 240 pixels | 490 × 480 pixels | 784 × 768 pixels | 1,046 × 1,024 pixels | 2,086 × 2,043 pixels.
Original file (2,086 × 2,043 pixels, file size: 166 KB, MIME type: image/jpeg)
Captions
Captions
Add a one-line explanation of what this file represents
| Description |
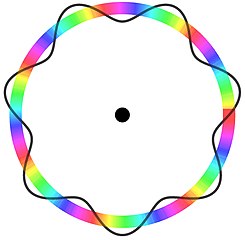
English: Two representations of a hydrogenic de-Broglie wave; the ring represents the electron's phase as a color, the wavy line shows the phase using a polar plot of a sinus curve. |
||
| Source | Own work | ||
| Author | Pieter Kuiper | ||
| Permission (Reusing this file) |
|
This diagram was created with Mathematica.
Mathematica code:
circle = PolarPlot[1,{t,0,2 Pi}, ColorFunction -> Function[{x,y,t,r}, Hue[7 t, 0.7]], PlotStyle -> Thickness[0.05], MaxRecursion -> 3];
wave = PolarPlot[1 + 1/8 Sin[7 t], {t, 0, 2 Pi}, PlotStyle -> {Thickness[0.01], GrayLevel[0.0, 0.5]};
graph = Show[wave, circle, wave, Graphics[Disk[{0, 0}, 0.07]], Axes -> None, ImageSize -> Scaled[2.0]]
Export["Atom_deBroglie.jpg", graph]
There must be ways to get rid of the discontinuities in color, but I do not know how.
File history
Click on a date/time to view the file as it appeared at that time.
| Date/Time | Thumbnail | Dimensions | User | Comment | |
|---|---|---|---|---|---|
| current | 12:11, 17 April 2009 | | 2,086 × 2,043 (166 KB) | Pieter Kuiper (talk | contribs) | {{Information |Description={{en|1=Two representations of a hydrogenic de-Broglie wave; the ring represents the electron's phase as a color, the wavy line shows the phase using a polar plot of a sinus curve.}} |Source=Own work by uploader |Author=[[User:Pi |
You cannot overwrite this file.
File usage on Commons
The following page uses this file:
File usage on other wikis
The following other wikis use this file:
- Usage on en.wikiquote.org
- Usage on no.wikipedia.org
- Usage on sv.wikipedia.org
- Usage on www.wikidata.org