File:Atmospheric ozone.svg
Jump to navigation
Jump to search

Size of this PNG preview of this SVG file: 800 × 467 pixels. Other resolutions: 320 × 187 pixels | 640 × 373 pixels | 1,024 × 597 pixels | 1,280 × 747 pixels | 2,560 × 1,493 pixels | 1,200 × 700 pixels.
Original file (SVG file, nominally 1,200 × 700 pixels, file size: 15 KB)
Captions
Captions
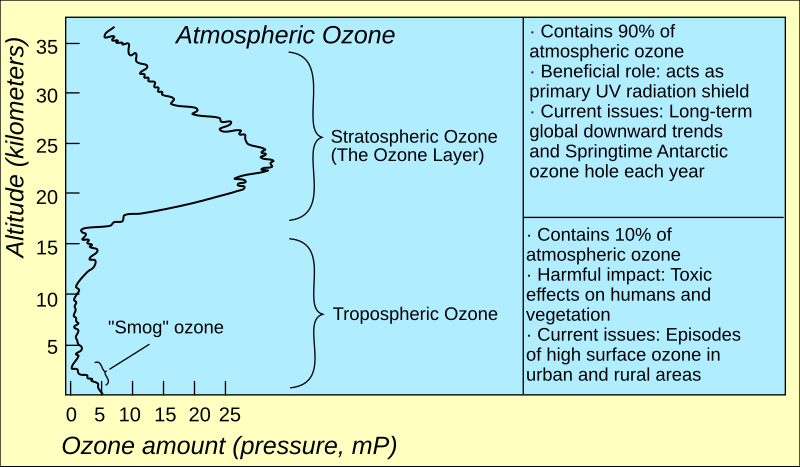
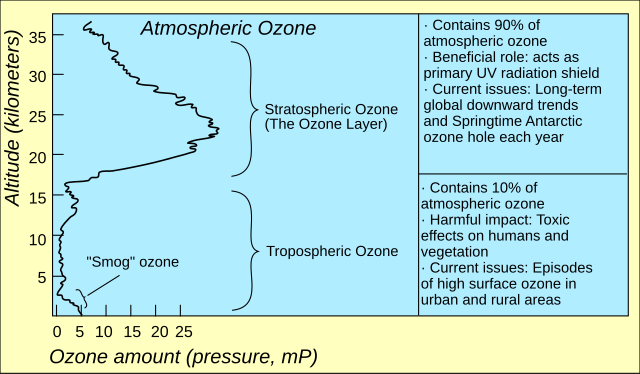
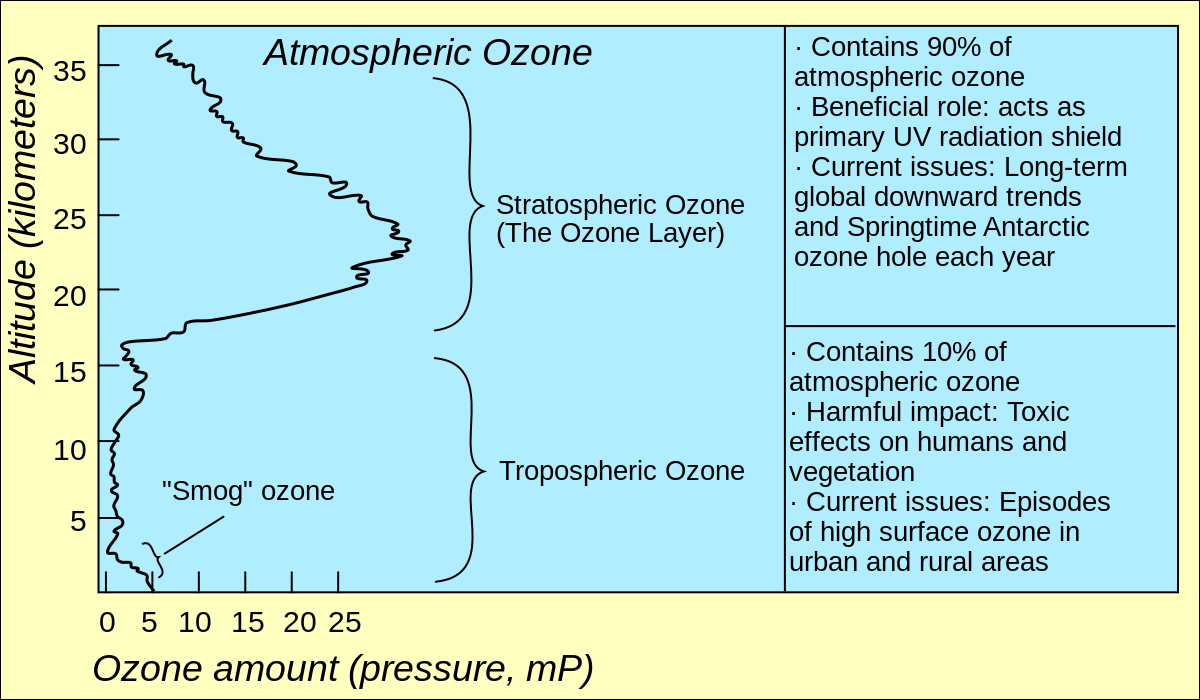
statistics of ozone depletion at different layers of the earth
Summary[edit]
| Description |
English: The distribution of atmospheric ozone in partial pressure as a function of altitude. |
| Date | |
| Source | Own work using: Earth Observing System (EOS) Science Plan. Chapter 7. Ozone and Stratospheric Chemistry |
| Author | Rastrized and improved by RedAndr |
| Other versions |
|
| SVG development | This diagram was created with an unknown SVG tool. This diagram is translated using SVG switch elements: all translations are stored in the same file. |


Licensing[edit]
| This file is in the public domain in the United States because it was solely created by NASA. NASA copyright policy states that "NASA material is not protected by copyright unless noted". (See Template:PD-USGov, NASA copyright policy page or JPL Image Use Policy.) | ||
 |
Warnings:
|
File history
Click on a date/time to view the file as it appeared at that time.
| Date/Time | Thumbnail | Dimensions | User | Comment | |
|---|---|---|---|---|---|
| current | 21:49, 30 March 2024 | | 1,200 × 700 (15 KB) | Mrmw (talk | contribs) | |
| 21:36, 30 March 2024 |  | 1,200 × 700 (31 KB) | Mrmw (talk | contribs) | cleaned code | |
| 16:32, 25 January 2024 |  | 1,206 × 688 (69 KB) | Mister Pommeroy (talk | contribs) | File uploaded using svgtranslate tool (https://svgtranslate.toolforge.org/). Added translation for de. | |
| 08:33, 8 March 2020 |  | 1,206 × 688 (65 KB) | Alvaro Vidal-Abarca (talk | contribs) | Added language support for ru | |
| 08:01, 8 March 2020 |  | 1,206 × 688 (57 KB) | Alvaro Vidal-Abarca (talk | contribs) | Added support for language ca | |
| 07:54, 8 March 2020 |  | 1,206 × 688 (49 KB) | Alvaro Vidal-Abarca (talk | contribs) | Added language support for es | |
| 07:26, 8 March 2020 |  | 1,162 × 688 (386 KB) | Alvaro Vidal-Abarca (talk | contribs) | Reverted to version as of 13:53, 20 June 2007 (UTC) | |
| 07:08, 8 March 2020 |  | 1,206 × 688 (40 KB) | Alvaro Vidal-Abarca (talk | contribs) | Support for translatable text | |
| 13:53, 20 June 2007 |  | 1,162 × 688 (386 KB) | RedAndr (talk | contribs) | The distribution of atmospheric ozone in partial pressure as a function of altitude. Rastrized and improved by user:RedAndr [http://eospso.gsfc.nasa.gov/science_plan/ Earth Observing System (EOS) Science Plan. Chapter 7. Ozone and Stratospheric Chem |
You cannot overwrite this file.
File usage on Commons
The following 3 pages use this file:
File usage on other wikis
The following other wikis use this file:
- Usage on ca.wikipedia.org
- Usage on de.wikipedia.org
- Usage on de.wikibooks.org
- Usage on en.wikipedia.org
- Usage on en.wikibooks.org
- Usage on fa.wikipedia.org
- Usage on fr.wikipedia.org
- Usage on hr.wikipedia.org
- Usage on kn.wikipedia.org
- Usage on lfn.wikipedia.org
- Usage on sh.wikipedia.org
- Usage on sl.wikipedia.org
- Usage on sr.wikipedia.org
- Usage on te.wikipedia.org