File:Asset and money market graph.png
Jump to navigation
Jump to search

Size of this preview: 800 × 508 pixels. Other resolutions: 320 × 203 pixels | 640 × 406 pixels | 1,076 × 683 pixels.
Original file (1,076 × 683 pixels, file size: 31 KB, MIME type: image/png)
Captions
Captions
Add a one-line explanation of what this file represents
| Description |
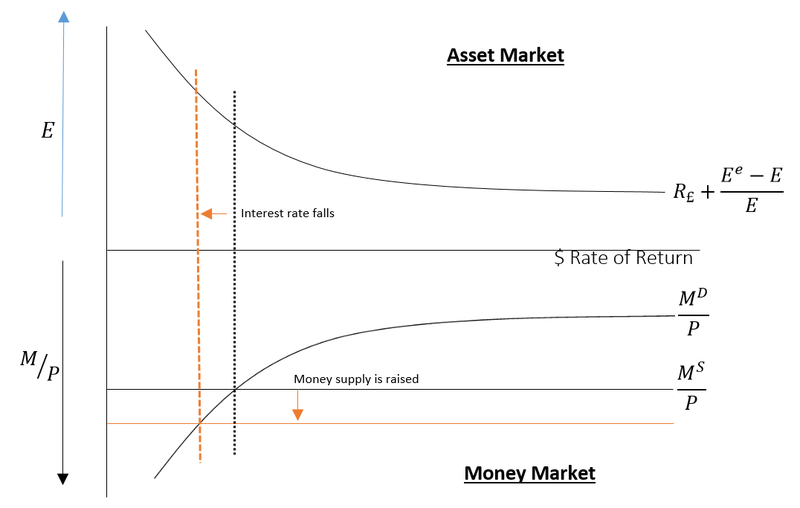
English: This is a graph from International Economics that is a combination of the asset and money market graphs, to show the equilibrium and resulting change from raising money supply. The work is my own, created in Microsoft Word 2013 (visit my Talk page if you want the source .docx file). |
|||
| Source | Own work | |||
| Author | Jake Wasdin | |||
| Permission (Reusing this file) |
|

File history
Click on a date/time to view the file as it appeared at that time.
| Date/Time | Thumbnail | Dimensions | User | Comment | |
|---|---|---|---|---|---|
| current | 15:53, 27 December 2013 | | 1,076 × 683 (31 KB) | Jake Wasdin (talk | contribs) | {{Information |Description ={{en|1=This is a graph from International Economics that is a combination of the asset and money market graphs, to show the equilibrium and resulting change from raising money supply. The work is my own, created in Micros... |
You cannot overwrite this file.
File usage on Commons
The following page uses this file: