File:A vast array of physical and biological systems across the Earth are being affected by human-induced global warming.png
Jump to navigation
Jump to search

Size of this preview: 467 × 599 pixels. Other resolutions: 187 × 240 pixels | 374 × 480 pixels | 599 × 768 pixels | 798 × 1,024 pixels | 1,596 × 2,048 pixels | 4,322 × 5,544 pixels.
Original file (4,322 × 5,544 pixels, file size: 4.5 MB, MIME type: image/png)
Captions
Captions
Add a one-line explanation of what this file represents
Summary[edit]
| Description |
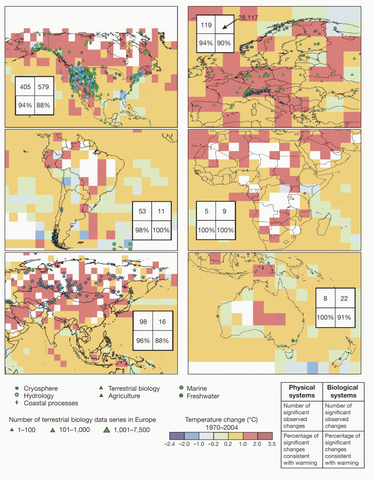
English: The diagram shows widespread evidence of warming temperatures having affected many physical and biological systems across the world. From the source, written by Cynthia Rosenzweig (2008): "Researchers from NASA GISS and from 10 other institutions across the world analyzed data from published papers on 829 physical systems and some 28,800 plant and animal systems, stretching back to 1970. [...] In physical systems, 95 percent of observed changes are consistent with warming trends. These include wastage of glaciers on all continents; melting permafrost; earlier spring river runoff; and warming of water bodies. The study also found that 90 percent of documented changes among living creatures are consistent with warming. [...] It is unlikely that any force other than human-influenced global warming could be driving these changes; factors such as deforestation or natural climate variations could not explain it. The work builds upon the consensus of the Intergovernmental Panel on Climate Change, which in 2007 declared human-made climate warming "likely" to have discernible effects on biological and physical systems" (end quote of Rosenzweig, 2008). The diagram itself shows the location and consistency of observed changes with warming. Changes in physical systems include snow, ice and frozen ground as well as hydrology and coastal processes. Changes in biological systems include terrestrial, marine and freshwater biological systems. The diagram also shows linear trends of surface air temperature between 1970 and 2004. The trends in surface air temperature are based on the "HadCRUT3" dataset, which has been developed by the UK Hadley Centre and the Climatic Research Unit (CRU) (Jones and Salmon, 2011). The CRU is based at the University of East Anglia, in the UK. Some parts of the mapped data are white. These areas do not contain sufficient climate data to estimate a trend. "Our findings show that patterns of change are strongest in North America, Asia and Europe, mainly because far more studies have been done there. On the other continents, including South America, Australia and Africa, documentation of changes in physical and biological systems is sparse, even though there is good evidence of human-influenced warming itself. There is an urgent need to study these and other environmental systems, especially in tropical and subtropical areas" (Rosenzweig, 2008). |
| Date | |
| Source | Science Briefs: Warming Climate is Changing Life on Global Scale, website of the US National Aeronautics and Space Administration, Goddard Institute for Space Studies. Retrieved 2011-07-08. The diagram itself was copied from a high resolution PDF file linked-to on this website. The text for the image description also refers to the website of the Climatic Research Unit, based at the University of East Anglia in the UK: Temperature data (HadCRUT3 and CRUTEM3), written by Phil Jones and Mike Salmon, last updated 2011-01-01. Retrieved 2011-07-08. |
| Author | Cynthia Rosenzweig |
| Permission (Reusing this file) |
"NASA images generally are not copyrighted. You may use NASA imagery, video and audio material for educational or informational purposes, including photo collections, textbooks, public exhibits and Internet Web pages." http://www.nasa.gov/centers/goddard/multimedia/gtv_copyright.html |
| Other versions | File:A vast array of physical and biological systems across the Earth are being affected by human-induced global warming (low-res).png |
.png)
Licensing[edit]
| This file is in the public domain in the United States because it was solely created by NASA. NASA copyright policy states that "NASA material is not protected by copyright unless noted". (See Template:PD-USGov, NASA copyright policy page or JPL Image Use Policy.) | ||
 |
Warnings:
|
File history
Click on a date/time to view the file as it appeared at that time.
| Date/Time | Thumbnail | Dimensions | User | Comment | |
|---|---|---|---|---|---|
| current | 18:45, 9 July 2011 | | 4,322 × 5,544 (4.5 MB) | Enescot (talk | contribs) | {{Information |Description ={{en|1=The diagram shows widespread evidence of warming temperatures having affected many physical and biological systems across the world. From the source, written by Cynthia Rosenzweig (2008): "Researchers from NASA GISS a |
You cannot overwrite this file.
File usage on Commons
There are no pages that use this file.