File:3x3 rondsLamiotWikimediaCommons.jpg
Jump to navigation
Jump to search
Size of this preview: 653 × 599 pixels. Other resolutions: 262 × 240 pixels | 523 × 480 pixels | 812 × 745 pixels.
Original file (812 × 745 pixels, file size: 107 KB, MIME type: image/jpeg)
Captions
Captions
Add a one-line explanation of what this file represents
Summary[edit]
| Description |
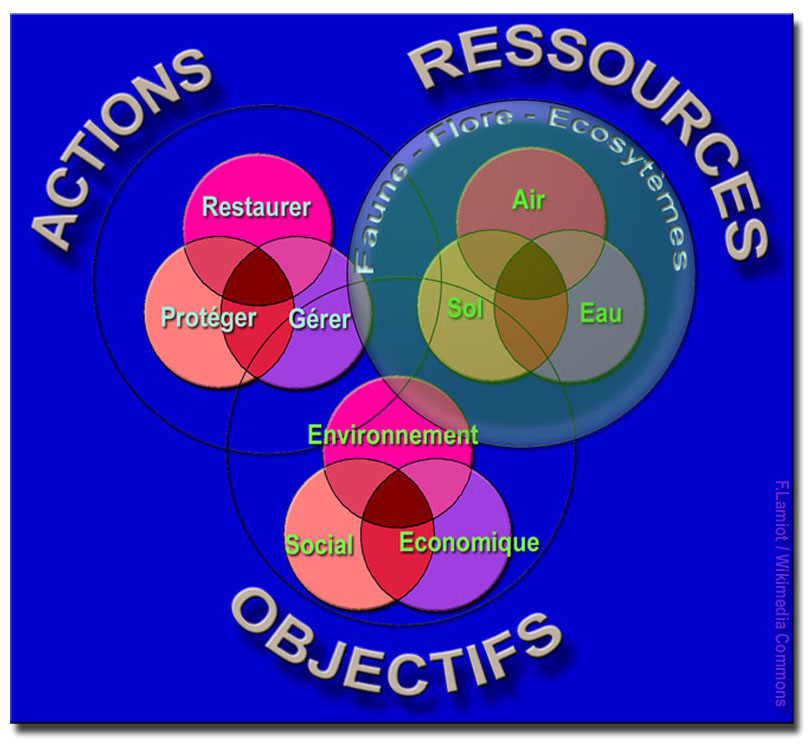
English: Graphic and colored representation of the interrelationships between main areas of sustainable development. This diagram describes the need to manage, restore and protect vital resources (water, air, soil, produced or maintained by biodiversity through ecosystems and resources which are not few, difficultly, expensively or slowly renewable), for this goals that are both social, economic and environmental so. The intersections between the spheres (or groups of spheres) represent interfaces in pairs, or three to three basic items.
This type of representation allows to keep an overview of a problem (an impact assessment, a project, a "Agenda 21", a collective or individual situation, etc..) And perhaps, it can be used as a short checklist in the exploration of a problem with an ecosystem or systemic. It is also easy to memorize. Français : Interrelations entre grands « domaines » (ou enjeux) du développement soutenable, montrant le besoin de gérer, restaurer et protéger ... des ressources (eau, air, sol qui sont à la fois des compartiments environnementaux et des ressources naturelles), exclusivement produites ou entretenues par la biodiversité (via les écosystèmes et les services écosystémiques et qui sont des ressources pas, peu, difficilement, coûteusement ou lentement renouvelables ... ceci pour des objectifs sociaux, économiques et environnementaux. Les intersections entre sphères et groupes de sphères représentent les interfaces deux à deux, ou trois à trois des items de base. Ce schéma aide à avoir une vue globale d'un problème (une étude d'impact, un Agenda 21, une évaluation environnementale individuelle ou collective, etc. peuvent s'en inspirer) ; Il peut - pour partie - servir de check-list pour traiter un sujet avec une approche écosystémique ou systémique. Ce diagramme est facile à mémoriser. Il peut être complété par l'approche "éviter-réduire-compenser" |
| Date | |
| Source | Own work |
| Author | Lamiot |
J'ai aussi réalisé une version animée pou powerPoint, qui présentes les cercle, et les mots apparaissant l'un après l'autre, ce qui permet - lors d'une formation par exemple - d'expliquer plus pédagogiquement comment "tout se tient" dans le domaine du développement dit "soutenable"
Licensing[edit]
I, the copyright holder of this work, hereby publish it under the following licenses:

|
Permission is granted to copy, distribute and/or modify this document under the terms of the GNU Free Documentation License, Version 1.2 or any later version published by the Free Software Foundation; with no Invariant Sections, no Front-Cover Texts, and no Back-Cover Texts. A copy of the license is included in the section entitled GNU Free Documentation License. |
This file is licensed under the Creative Commons Attribution-Share Alike 3.0 Unported, 2.5 Generic, 2.0 Generic and 1.0 Generic license.
- You are free:
- to share – to copy, distribute and transmit the work
- to remix – to adapt the work
- Under the following conditions:
- attribution – You must give appropriate credit, provide a link to the license, and indicate if changes were made. You may do so in any reasonable manner, but not in any way that suggests the licensor endorses you or your use.
- share alike – If you remix, transform, or build upon the material, you must distribute your contributions under the same or compatible license as the original.
You may select the license of your choice.
File history
Click on a date/time to view the file as it appeared at that time.
| Date/Time | Thumbnail | Dimensions | User | Comment | |
|---|---|---|---|---|---|
| current | 15:42, 2 September 2009 | | 812 × 745 (107 KB) | Lamiot (talk | contribs) | {{Information |Description={{en|1=Graphic and colored representation of the interrelationships between main areas of sustainable development. This diagram describes the need to manage, restore and protect vital resources (water, air, soil, produced or mai |
You cannot overwrite this file.
File usage on Commons
There are no pages that use this file.
File usage on other wikis
The following other wikis use this file:
- Usage on en.wikiversity.org
- Usage on fr.wikipedia.org
- Usage on fr.wikibooks.org