File:2019 tour de france top contenders.svg
Jump to navigation
Jump to search

Size of this PNG preview of this SVG file: 800 × 416 pixels. Other resolutions: 320 × 166 pixels | 640 × 333 pixels | 1,024 × 533 pixels | 1,280 × 666 pixels | 2,560 × 1,332 pixels | 1,111 × 578 pixels.
Original file (SVG file, nominally 1,111 × 578 pixels, file size: 66 KB)
Captions
Captions
Add a one-line explanation of what this file represents
Summary[edit]
| Description |
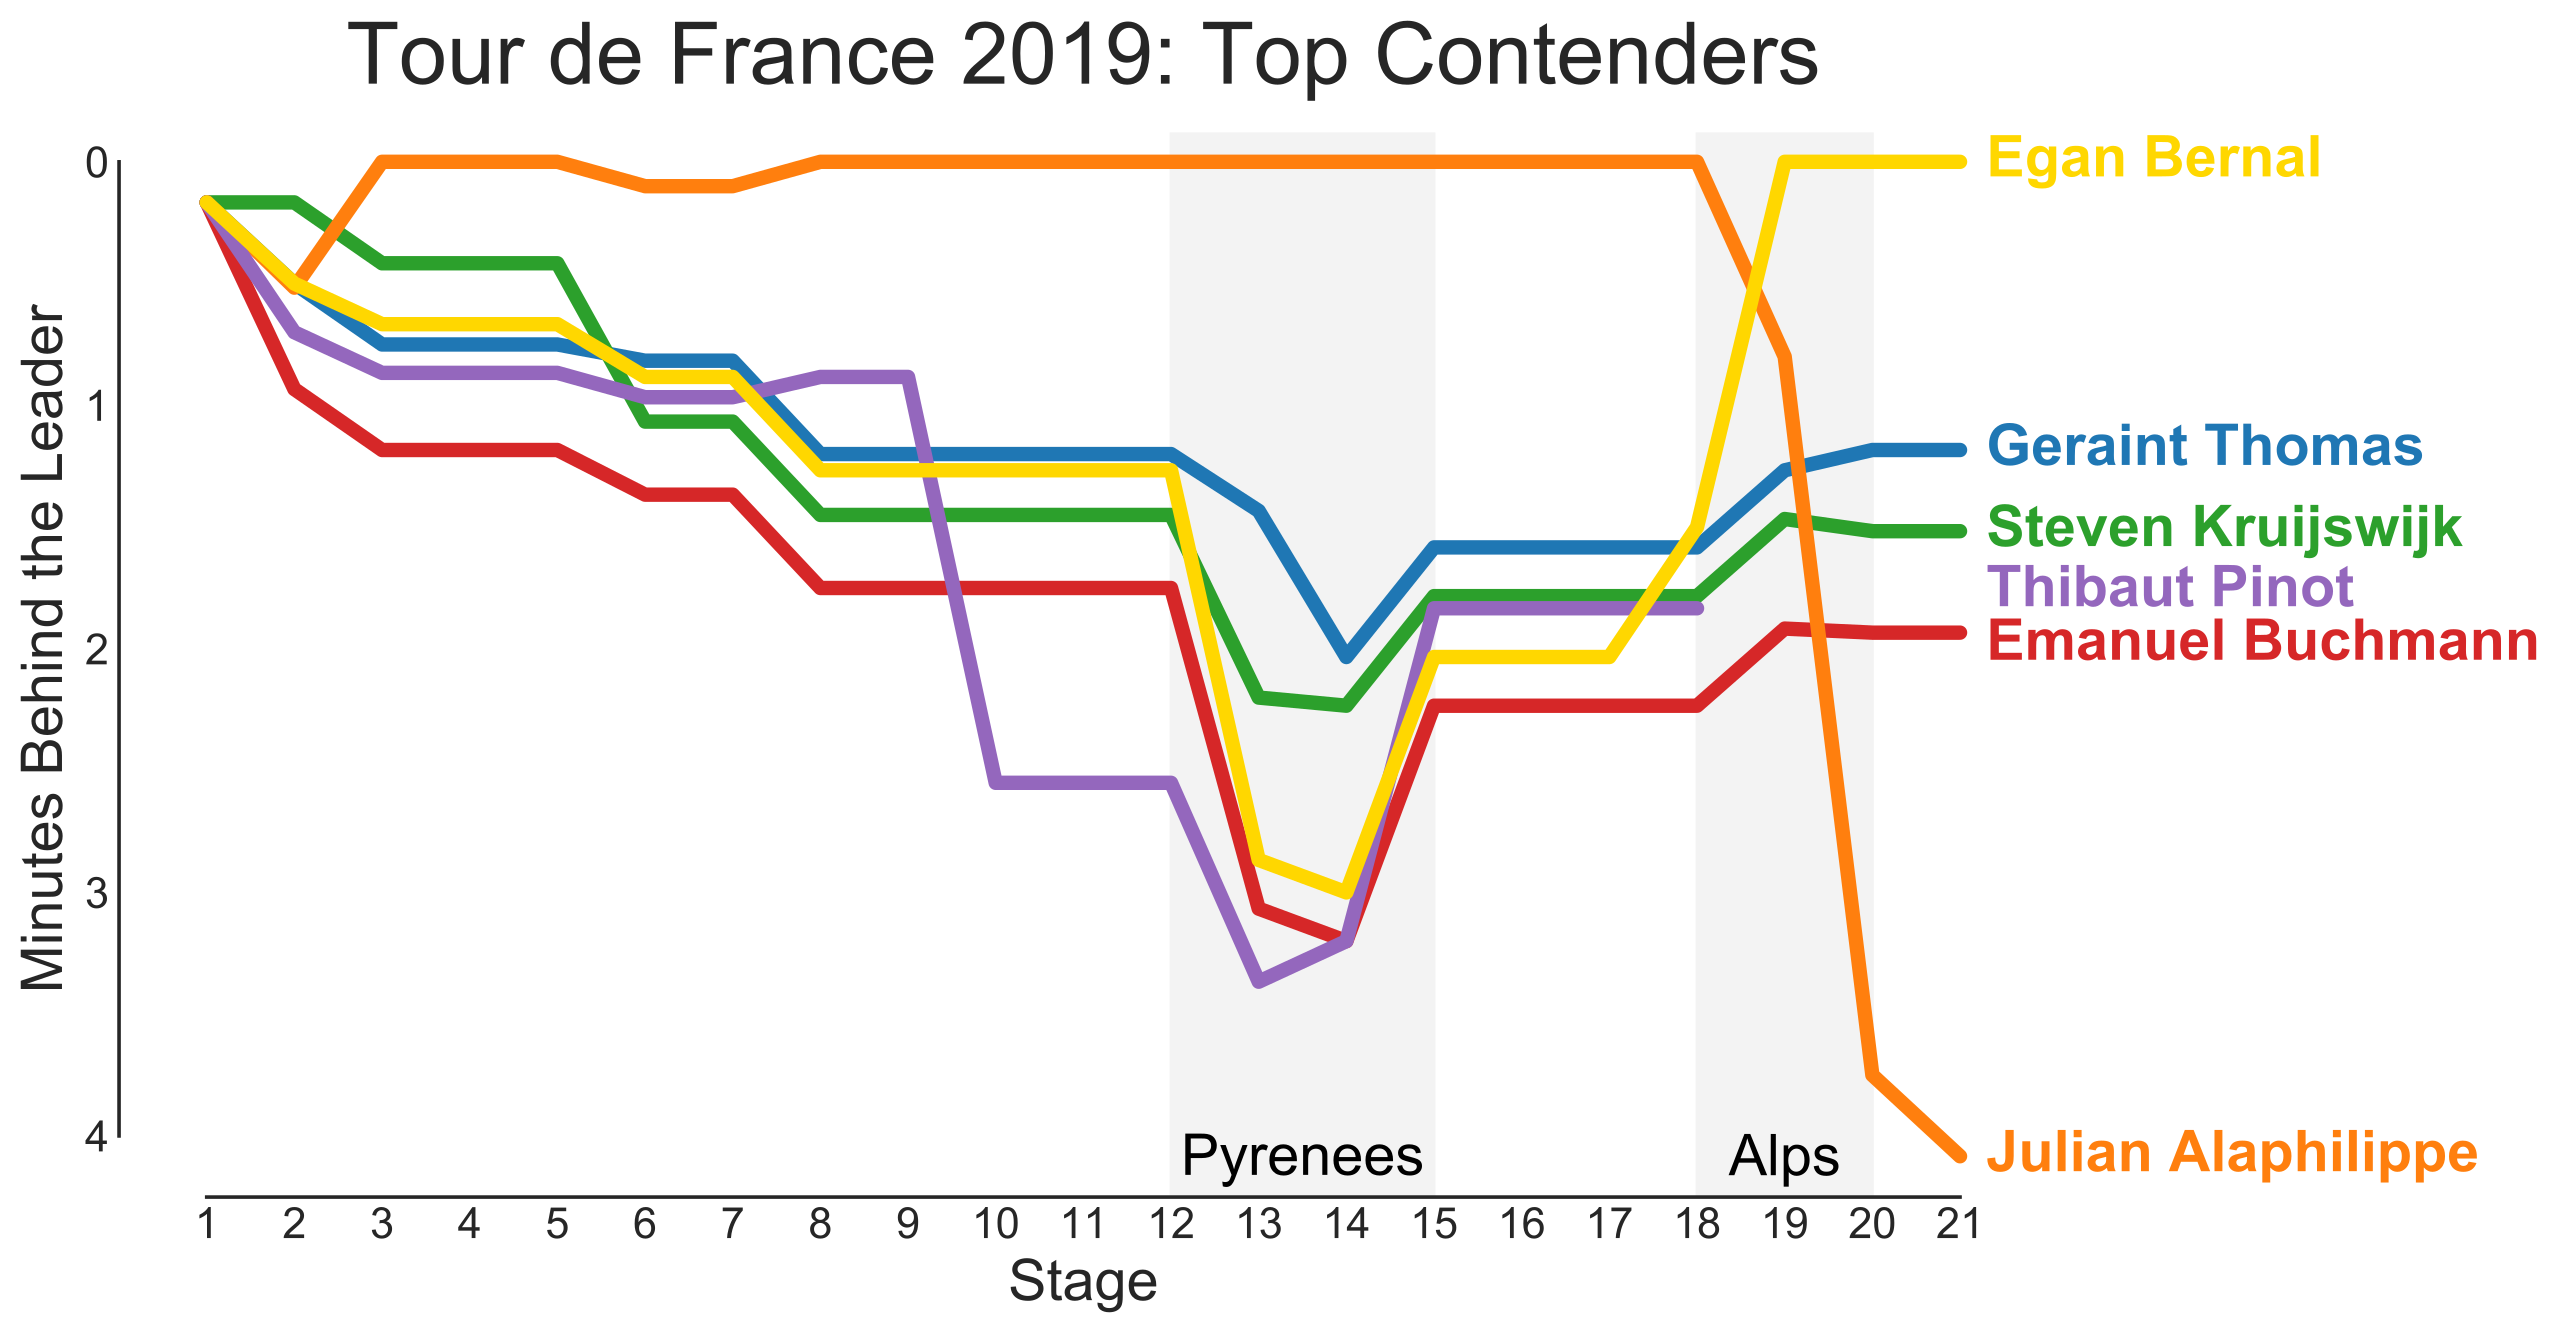
English: The time behind the leader of the 2019 Tour de France for the top 5 riders and Thibaut Pinot:
Egan Bernal
Geraint Thomas
Steven Kruijswijk
Thibaut Pinot
Emanuel Buchmann
Julian Alaphilippe |
||
| Date | |||
| Source | Own work | ||
| Author | Falcorian | ||
| SVG development | This plot was created with Matplotlib. | ||
| Source code | Python code#!/usr/bin/env python
# coding: utf-8
# In[1]:
import pandas as pd
import seaborn as sns
import matplotlib.pyplot as plt
from collections import namedtuple
from scipy.interpolate import interp1d
import numpy as np
from itertools import cycle
import matplotlib.patches as mpatches
# In[2]:
# Set plotting style
plt.style.use("seaborn-white")
WIDTH = 12
HEIGHT = 7
# Hardcoded Colors
YELLOW_JERSEY_COLOR = "gold"
GREEN_JERSEY_COLOR = "#2ca02c"
POLKADOT_JERSEY_COLOR = "#d62728"
WHITE_JERSEY_COLOR = "black"
LANTERNE_ROUGE_COLOR = "darkred"
OTHER_RIDER_COLOR = "grey"
# Default colors
prop_cycle = plt.rcParams['axes.prop_cycle']
DEFAULT_COLORS = cycle(prop_cycle.by_key()['color'])
get_ipython().run_line_magic('matplotlib', 'inline')
# In[3]:
def reset_color_cycle():
return cycle(prop_cycle.by_key()['color'])
# In[4]:
DNF = 999
LAST_STAGE = 21
TOUR_YEAR = 2019
# # Helper functions
# In[5]:
RiderRow = namedtuple("RiderRow", ["rider", "final_place", "x", "y"])
# In[6]:
RiderPlotProp = namedtuple("RiderPlotProp", ["color", "y_nudge"], defaults=[OTHER_RIDER_COLOR, 0.])
# In[7]:
def make_plot_tuples(df, x_col="stage", y_col="gap_seconds"):
"""Creates a `rider_row` with riders, place, x, and y arrays."""
# Get stage and final ranks
finished_riders_by_rank = df[]["stage"]==LAST_STAGE][["rider", "rank"]]
merged_df = pd.merge(left=df, right=finished_riders_by_rank, how="left", on="rider")
merged_df = merged_df.rename(columns={"rank_x": "stage_rank", "rank_y": "final_rank"})
merged_df["final_rank"] = merged_df["final_rank"].fillna(DNF)
ordered_riders = merged_df[]["stage"]==1].sort_values(["final_rank"])[["rider", "final_rank"]].to_numpy()
# Get the X, Y values for each rider
rider_rows = []
for rider, rank in ordered_riders:
sub_df = merged_df[]["rider"]==rider]
x = sub_df[x_col].to_numpy()
y = sub_df[y_col].to_numpy()
rider_rows.append(RiderRow(rider, rank, x, y))
return rider_rows
# In[8]:
def get_zorder_alpha(color):
alpha = 1
zorder = 0
if color == OTHER_RIDER_COLOR:
zorder = -1
alpha = 0.3
elif color == YELLOW_JERSEY_COLOR:
zorder = 1
return zorder, alpha
# In[9]:
def plot_lines(x, y, color=OTHER_RIDER_COLOR, label=None):
zorder, alpha = get_zorder_alpha(color)
xnew = np.linspace(1, LAST_STAGE, num=1000, endpoint=True)
cubic = interp1d(x, y, kind='cubic')
if label is None or color == OTHER_RIDER_COLOR:
label = None
plt.plot(
x, y, "-",
#xnew, cubic(xnew), "-",
alpha=alpha,
zorder=zorder,
color=color,
markersize=7.5,
linewidth=5,
label=label,
)
# In[10]:
def draw_left_legend(ax, special_riders):
for line in ax.lines:
label = line.get_label()
if label.startswith("_"):
continue
try:
y_nudge = special_riders[label].y_nudge
except KeyError:
y_nudge = 0
color = line.get_color()
y = line.get_ydata()[-1]
# Hard-code to the end of the current plot, even if they dropped out
x = LAST_STAGE
ax.annotate(
s=label,
xy=(x, y),
xytext=(x+.3, y+y_nudge),
color=color,
size=20,
weight="bold",
va="center"
)
# In[11]:
def make_plot(
rider_rows,
top_n=None,
max_minute=None,
special_riders={},
title=f"Tour de France {TOUR_YEAR}",
plot_mountains=False,
plot_mountain_lines=False,
):
fig, ax = plt.subplots(figsize=(WIDTH, HEIGHT))
# Set titles
plt.title(title, fontsize=30)
ax.set_ylabel("Minutes Behind the Leader", fontsize=20)
ax.set_xlabel("Stage", fontsize=20)
# Set the ticks to be every stage
stages = tuple(range(1, 22))
ax.set_xticks(stages)
ax.tick_params(axis='both', which='major', labelsize=15)
#plot_2d_hist(rider_rows)
for rider, place, x, y in rider_rows:
color = OTHER_RIDER_COLOR
if place == 1:
color = YELLOW_JERSEY_COLOR
elif rider in special_riders:
color = special_riders[rider].color
elif top_n is not None and place > top_n and color == OTHER_RIDER_COLOR:
continue
plot_lines(x, y, color, label=rider)
# Set ticks on the y axis
if max_minute is not None:
ax.set_ylim(-0.25, max_minute)
plt.gca().invert_yaxis()
draw_left_legend(ax, special_riders)
sns.despine(trim=True)
if plot_mountains:
Y_MAX=0.97
if plot_mountain_lines:
y=277
ax.axvline(18, color="black", linestyle="--", linewidth=2, ymax=Y_MAX, zorder=-2)
ax.axvline(20, color="black", linestyle="--", linewidth=2, ymax=Y_MAX, zorder=-2)
ax.axvline(12, color="black", linestyle="--", linewidth=2, ymax=Y_MAX, zorder=-2)
ax.axvline(15, color="black", linestyle="--", linewidth=2, ymax=Y_MAX, zorder=-2)
else:
y=4.1
ax.axvspan(18, 20, alpha=0.1, color="grey", zorder=-2, ymax=Y_MAX)
ax.axvspan(12, 15, alpha=0.1, color="grey", zorder=-2, ymax=Y_MAX)
ax.annotate(
s="Alps",
xy=(19, y),
color="black",
size=20,
va="center",
ha="center",
)
ax.annotate(
s="Pyrenees",
xy=(13.5, y),
color="black",
size=20,
va="center",
ha="center",
)
if top_n is not None:
filename = f"/tmp/{TOUR_YEAR}_tour_de_france_top_{top_n}."
else:
filename = f"/tmp/{TOUR_YEAR}_tour_de_france."
# Save to disk
for ext in ("png", "svg"):
fig.savefig(
f"{filename}{ext}", bbox_inches="tight"
)
# # Load the data
# In[12]:
df = pd.read_json(f"./data/{TOUR_YEAR}-tdf-dataframe.json", orient="table")
# In[13]:
df["gap_minutes"] = df["gap_seconds"] / 60
df["gap_hours"] = df["gap_seconds"] / 3600
# In[14]:
rider_rows = make_plot_tuples(df, x_col="stage", y_col="gap_minutes")
# # Make the plots
# In[15]:
DEFAULT_COLORS = reset_color_cycle()
TOP_SPECIAL_RIDERS = {
"Geraint Thomas": RiderPlotProp(next(DEFAULT_COLORS)),
"Julian Alaphilippe": RiderPlotProp(next(DEFAULT_COLORS)),
"Steven Kruijswijk": RiderPlotProp(next(DEFAULT_COLORS)),
"Emanuel Buchmann": RiderPlotProp(next(DEFAULT_COLORS), +0.05),
"Thibaut Pinot": RiderPlotProp(next(DEFAULT_COLORS), -0.07),
}
# In[16]:
make_plot(
rider_rows,
top_n=5,
max_minute=4.251,
special_riders=TOP_SPECIAL_RIDERS,
title="Tour de France 2019: Top Contenders",
plot_mountains=True,
)
# In[17]:
DEFAULT_COLORS = reset_color_cycle()
SPECIAL_RIDERS = {
"Peter Sagan": RiderPlotProp(GREEN_JERSEY_COLOR),
"Romain Bardet": RiderPlotProp(POLKADOT_JERSEY_COLOR, +3),
"Yoann Offredo": RiderPlotProp(next(DEFAULT_COLORS), -10),
"Sebastian Langeveld": RiderPlotProp(LANTERNE_ROUGE_COLOR),
"Julian Alaphilippe": RiderPlotProp(next(DEFAULT_COLORS), +13),
}
# In[18]:
make_plot(
rider_rows,
special_riders=SPECIAL_RIDERS,
plot_mountains=True,
plot_mountain_lines=True,
)
Data
|
Licensing[edit]
I, the copyright holder of this work, hereby publish it under the following licenses: This file is licensed under the Creative Commons Attribution-Share Alike Attribution-Share Alike 4.0 International, 3.0 Unported, 2.5 Generic, 2.0 Generic and 1.0 Generic license.
You may select the license of your choice. |
|||
|

File history
Click on a date/time to view the file as it appeared at that time.
| Date/Time | Thumbnail | Dimensions | User | Comment | |
|---|---|---|---|---|---|
| current | 04:46, 6 August 2019 | | 1,111 × 578 (66 KB) | Falcorian (talk | contribs) | == {{int:filedesc}} == {{Information |description={{en|1=The time behind the leader of the 2019 Tour de France for the top 5 riders and Thibaut Pinot: {{legend|#FFD700|Egan Bernal}} {{legend|#1F77B4|Geraint Thomas}} {{legend|#2CA02C|Steven Kruijswijk}} {{legend|#9467BD|Thibaut Pinot}} {{legend|#D62728|Emanuel Buchmann}} {{legend|#FF7F0E|Julian Alaphilippe}} }} |source={{own}} |author=Falcorian |date=2019-08-05 |other fields={{Igen|Matplotlib|+|code= #!/usr/bin/env python... |
You cannot overwrite this file.
File usage on Commons
The following page uses this file: