Category:Economic maps of Africa
Jump to navigation
Jump to search
Subcategories
This category has the following 17 subcategories, out of 17 total.
*
A
- Afrique Orange (4 F)
C
E
G
- GDP maps of Africa (17 F)
H
- HDI maps of Africa (17 F)
K
M
N
R
- Economic maps of Rwanda (1 F)
S
- Economic maps of SSC Khatumo (2 F)
T
- Economic maps of Tanzania (2 F)
Media in category "Economic maps of Africa"
The following 56 files are in this category, out of 56 total.
-
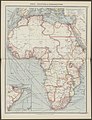 The Harmsworth atlas and Gazetter 1908 (135850503).jpg 9,577 × 12,539; 118.12 MB
-
 2013 Ivory Transportation (30885483595).jpg 4,258 × 2,940; 2.75 MB
-
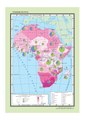
 239 of 'Pitman's Commercial Geography of the World' (11247948903).jpg 1,312 × 1,942; 606 KB
-
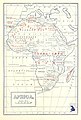
 84 of '(Longmans' Junior School Geography, etc.)' (11210830364).jpg 2,001 × 2,706; 986 KB
-
 Active RECs of the AEC.svg 1,000 × 1,000; 745 KB
-
 Adolescent Fertility and Poverty in Africa.jpg 612 × 792; 104 KB
-
 Africa Economic division.jpg 960 × 720; 56 KB
-
 Africa Free Trade Zone - member states.svg 1,000 × 1,000; 286 KB
-
 Africa transport.png 792 × 764; 57 KB
-
 Africa workforce map.pdf 1,752 × 2,479; 1.48 MB
-
 African Petroleum Producers Association members, June 2009.svg 750 × 900; 869 KB
-
 Africké Meny.png 1,000 × 1,000; 292 KB
-
 Afrique kwh.png 756 × 699; 20 KB
-
-
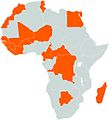
 Afriqueorangeimplantation20jul2016.png 1,349 × 1,280; 264 KB
-
 Afro use on the future.png 4,800 × 4,795; 1.07 MB
-
 Airtel Africa One Network Coverage.svg 1,000 × 1,000; 184 KB
-
 Anteil der Mittelschicht in afrikanischen Ländern 2010 - HBS.jpg 1,024 × 683; 215 KB
-
 Arrivals.svg 612 × 792; 120 KB
-
 Carte présence d'Orange en Afrique.jpg 1,435 × 1,574; 500 KB
-
 Celtel-map.png 757 × 785; 27 KB
-
 Celtel-one-map.png 757 × 785; 28 KB
-
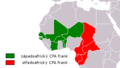
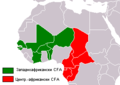
 CFA Franc map.svg 928 × 731; 127 KB
-
 CFA mapa.png 356 × 201; 6 KB
-
 Cfa mapbg.png 283 × 201; 6 KB
-
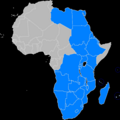
 COMESA - 2.png 940 × 794; 30 KB
-
 Commerce transsaharien.jpg 2,214 × 1,488; 1.33 MB
-
 Countries eligible for LLF financing.jpg 1,228 × 663; 74 KB
-
 Die 10 am schnellsten wachsenden Ökonomien Fokus Afrika - HBS.jpg 1,024 × 683; 169 KB
-
 East African Shilling Map.png 770 × 360; 28 KB
-
 Einkommensverteilung in afrikanischen Ländern nach GINI - HBS.jpg 1,024 × 724; 204 KB
-
 Energy Resources and Projects in Continental Africa, snapshot 2012.png 2,944 × 2,898; 804 KB
-
 Fdi africa.jpg 893 × 894; 203 KB
-
 Gabon - Economia.png 907 × 873; 230 KB
-
 Gas pipelines across Mediterranee and Sahara map-en.svg 832 × 1,573; 3.78 MB
-
 Ict-innovation-FBT-Fig-2.png 897 × 643; 330 KB
-
 Ict-innovation-FBT-fr-Fig-2.png 881 × 587; 341 KB
-
 LLF portfolio 2016-2021.png 1,113 × 923; 453 KB
-
 Map of ECOWAS.svg 638 × 635; 175 KB
-
 Mar Mediterranèa - Industria.png 3,518 × 1,791; 1.02 MB
-
 Other trade blocks in Africa.png 347 × 335; 13 KB
-
 Other trade blocks in Africa.svg 1,000 × 1,000; 181 KB
-
 Pêche et aquaculture (tonnes) en Afrique en 2000.png 729 × 671; 30 KB
-
 RECs of the AEC without CEN-SAD & COMESA.svg 1,000 × 1,000; 443 KB
-
 RECs of the AEC.svg 1,000 × 1,000; 1.81 MB
-
 RES4MED-Context.jpg 1,489 × 738; 341 KB
-
-
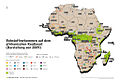 Rohstoffvorkommen auf dem afrikanischen Kontinent 2009 - HBS.jpg 1,024 × 683; 234 KB
-
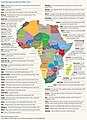 Top three export products in Africa, 2012.jpg 2,008 × 2,773; 2.43 MB
-
 Triangle trade.png 448 × 327; 246 KB
-
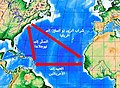 Triangular trade-AR.jpg 448 × 327; 96 KB
-
 Triangular trade.jpg 448 × 327; 78 KB
-
 Tripartite Free Trade Area.png 800 × 800; 73 KB
-
 Wachstumsraten der afrikanischen Länder 2001-2012 - HBS.jpg 1,024 × 683; 207 KB
-
 Wirtschaftliche Leistungsfähigkeit der afrikanischen Ökonomien - HBS.jpg 1,024 × 683; 232 KB
-
 « La grande roue » - l'Afrique et le monde.jpg 1,000 × 998; 1.21 MB
.jpg)
.jpg)
%27_(11210830364).jpg)


.jpg)


_en_Afrique_en_2000.png)


.jpg)